Full-service cost by US region
Three pinnable, 2:3 portrait infographics (1000×1500) summarizing the calculator's underlying data: regional breakdown, service-tier and guest-count scaling, and the top 10 most expensive US metros for full-service wedding planning. Every number is traceable to our methodology.
wedding-planner-price-calculator.vercel.app attribution strip visible and link back to this site. Data last updated 2026-04-22 — if you're seeing this page much later, check the live version for fresher numbers.
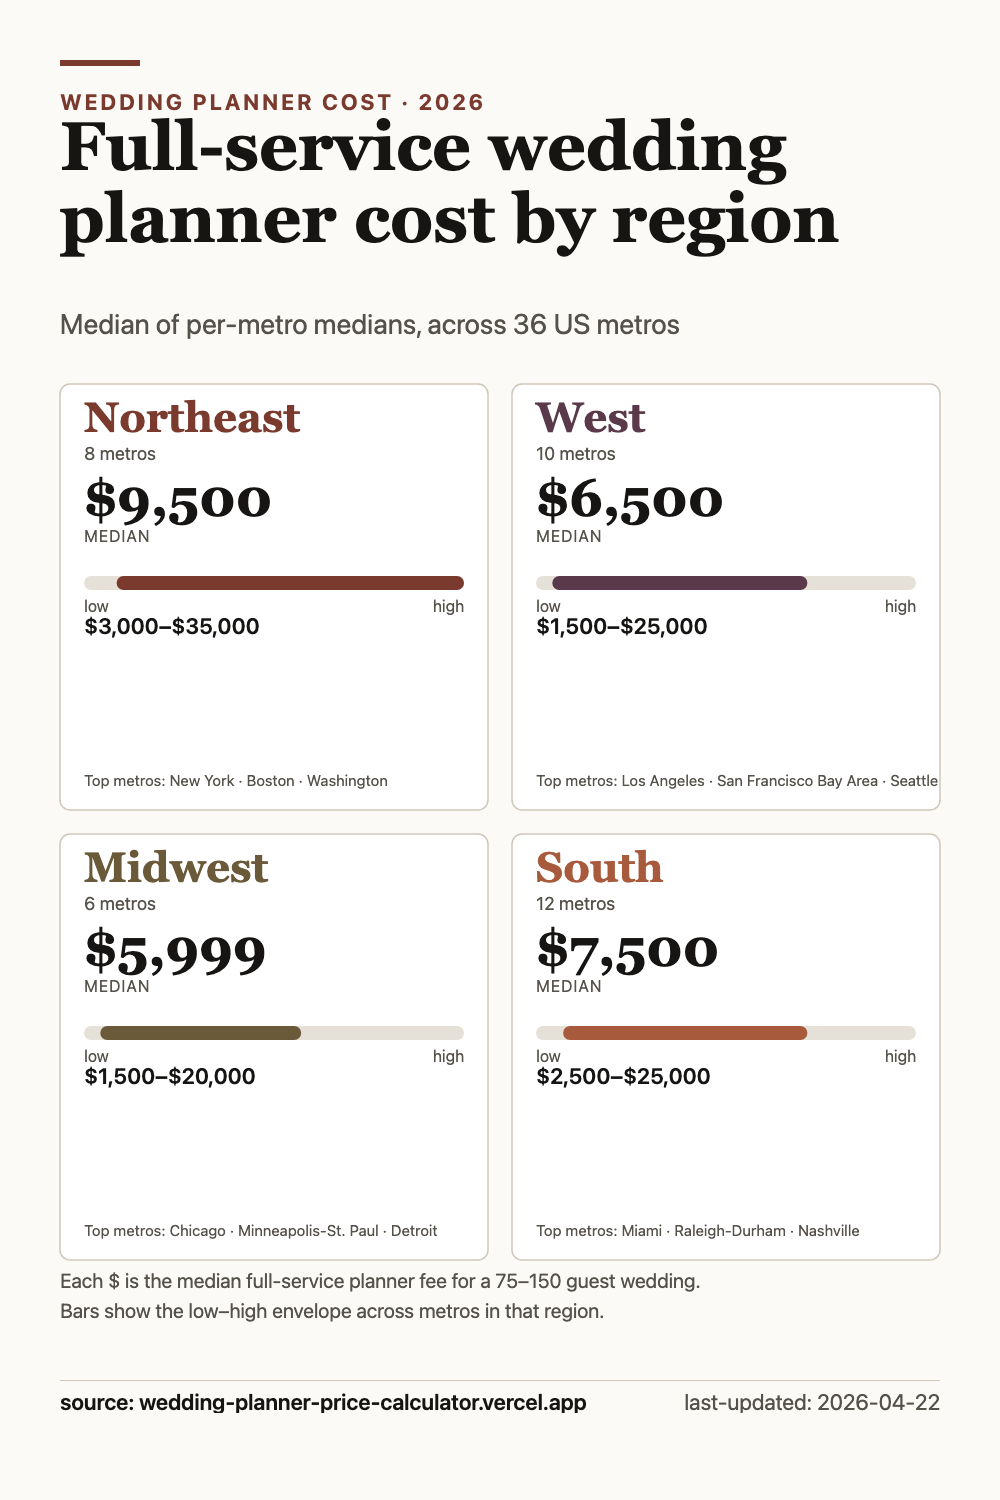
Full-service cost by US region
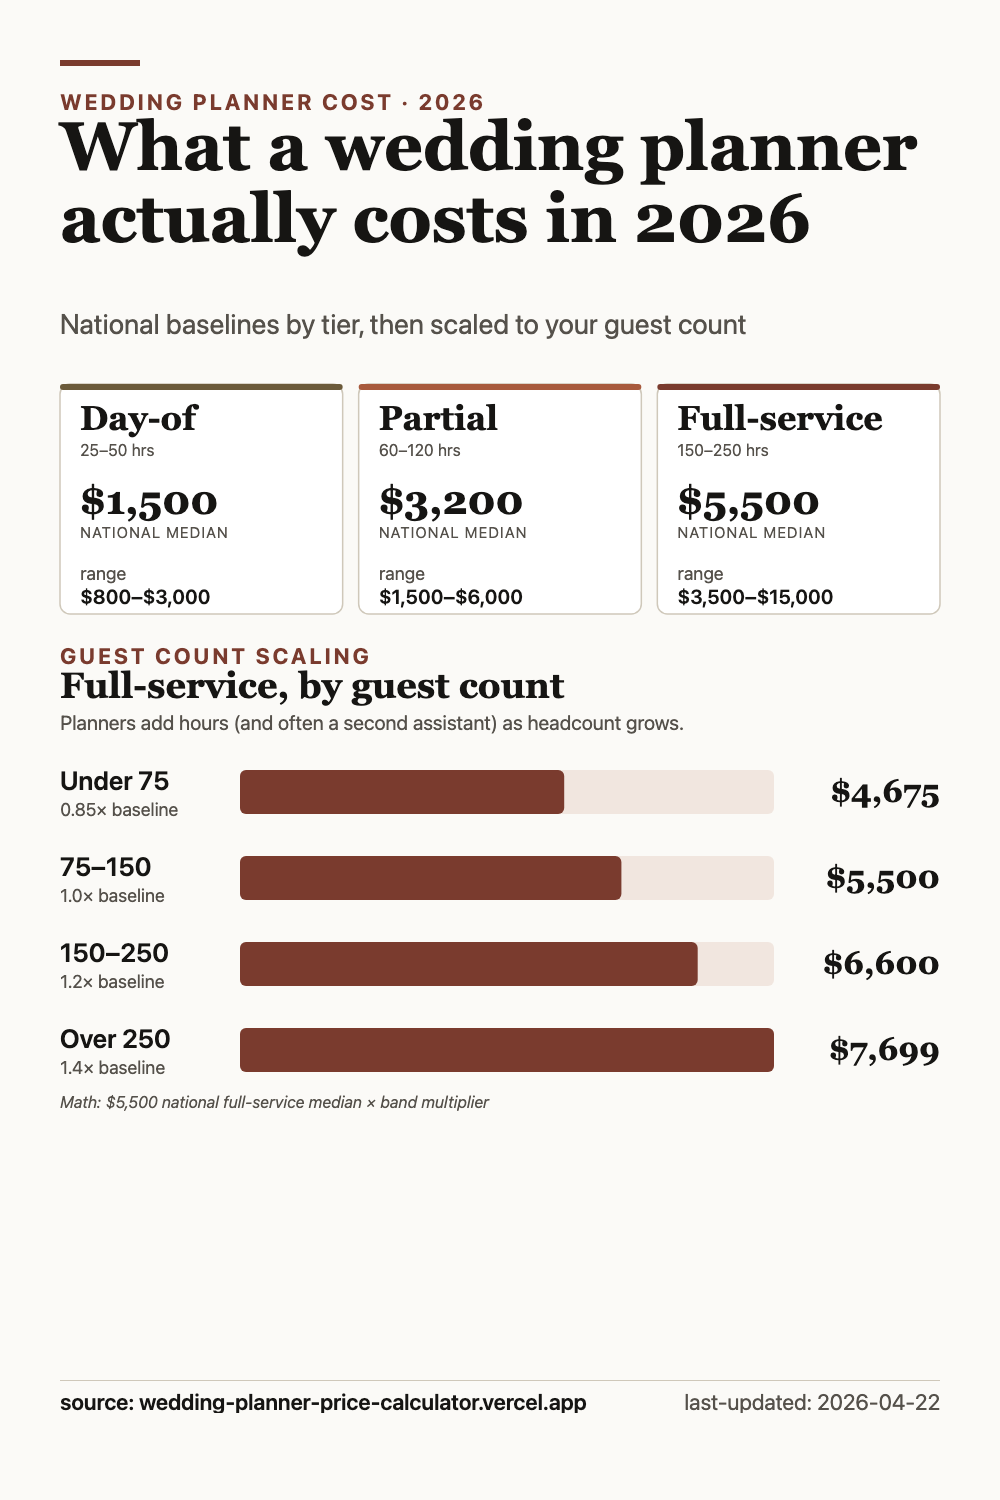
Planner cost by tier & guest count
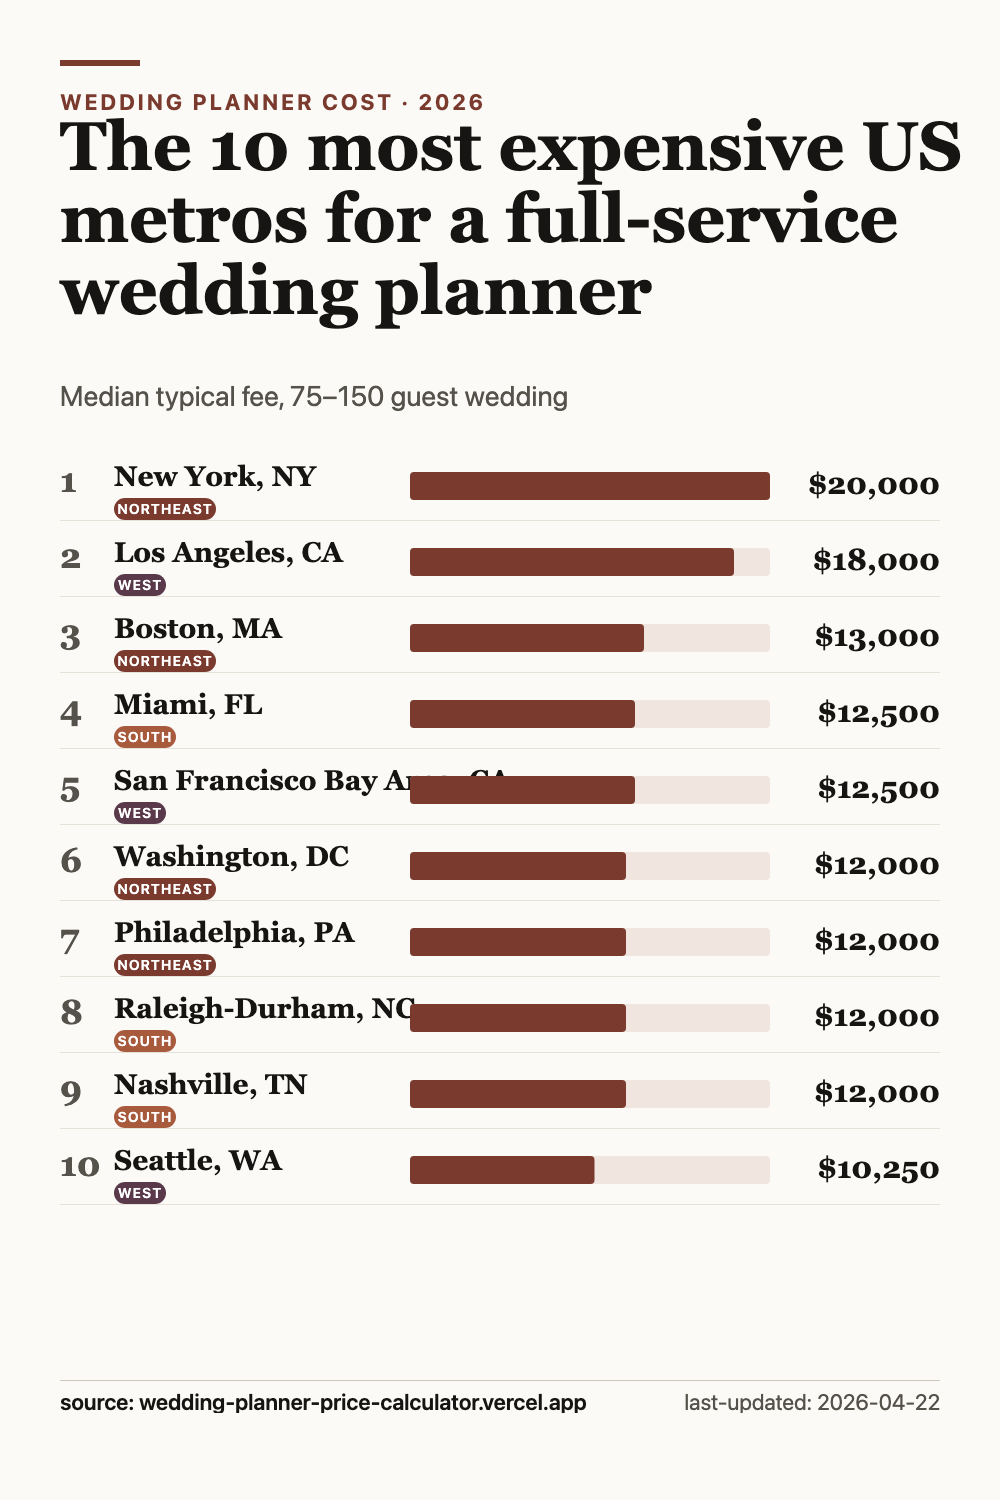
Top 10 most expensive US metros
Numbers come from 105 sourced pricing data points across 36 US metros — a mix of planner-published quotes, industry platform data (The Knot, Zola, Thumbtack), and national averages. See the methodology page for the full aggregation approach, tier definitions, and source review.
If you're a journalist or a wedding vendor who wants a custom cut of the data (e.g. a specific region, or a different guest-count slice), the underlying dataset is structured JSON — open an issue on the project's repo and we'll get back to you.
Prefer an interactive widget over a static infographic? The calculator itself is free to embed — copy-paste iframe, no signup, attribution required. See embed instructions.